
Toronto & York Region Real Estate
Market Watch: January 2026
Author: KATHLEEN MILLER REAL ESTATE
Date: February 17, 2026
Greater Toronto Area (GTA) Market Summary: A 10-Year Retrospective
The Greater Toronto Area real estate market has experienced significant fluctuations
over the past decade. An analysis of the Toronto Regional Real Estate Board (TRREB)
data from 2016 to 2025 reveals a market characterized by periods of rapid growth,
correction, and stabilization.
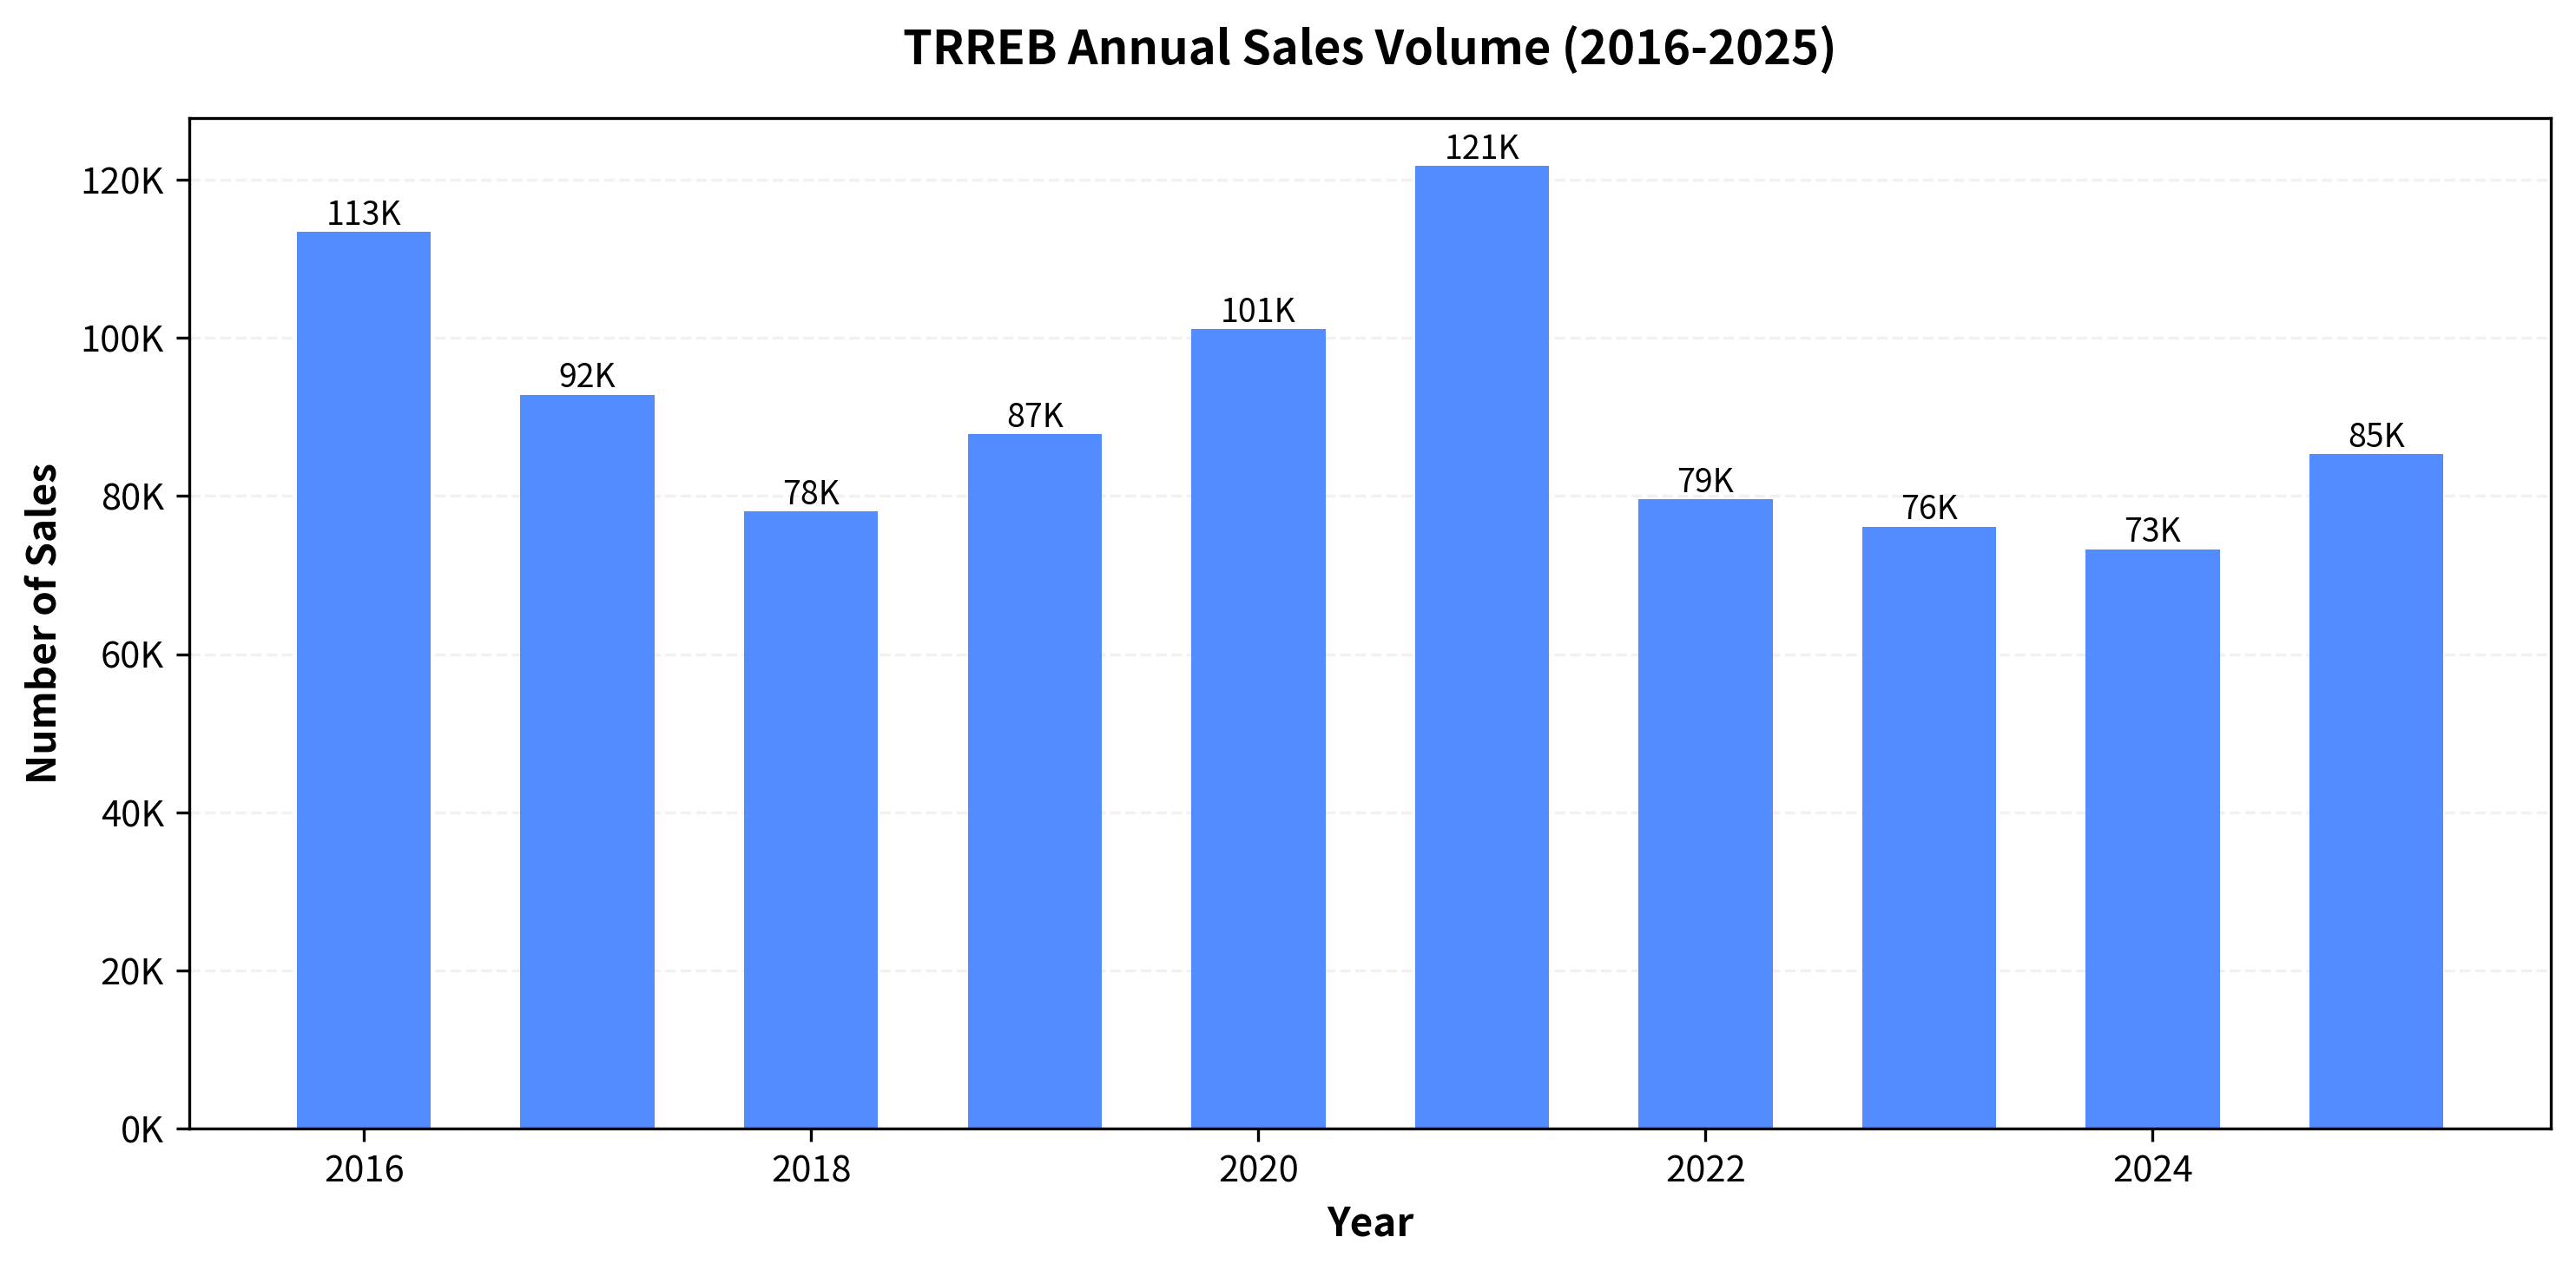
Sales volumes peaked in 2021, with over 121,000 transactions, before declining in
subsequent years. The most recent full-year data for 2025 shows a rebound in sales
activity compared to the previous two years, suggesting a potential return of buyer
confidence. [1]
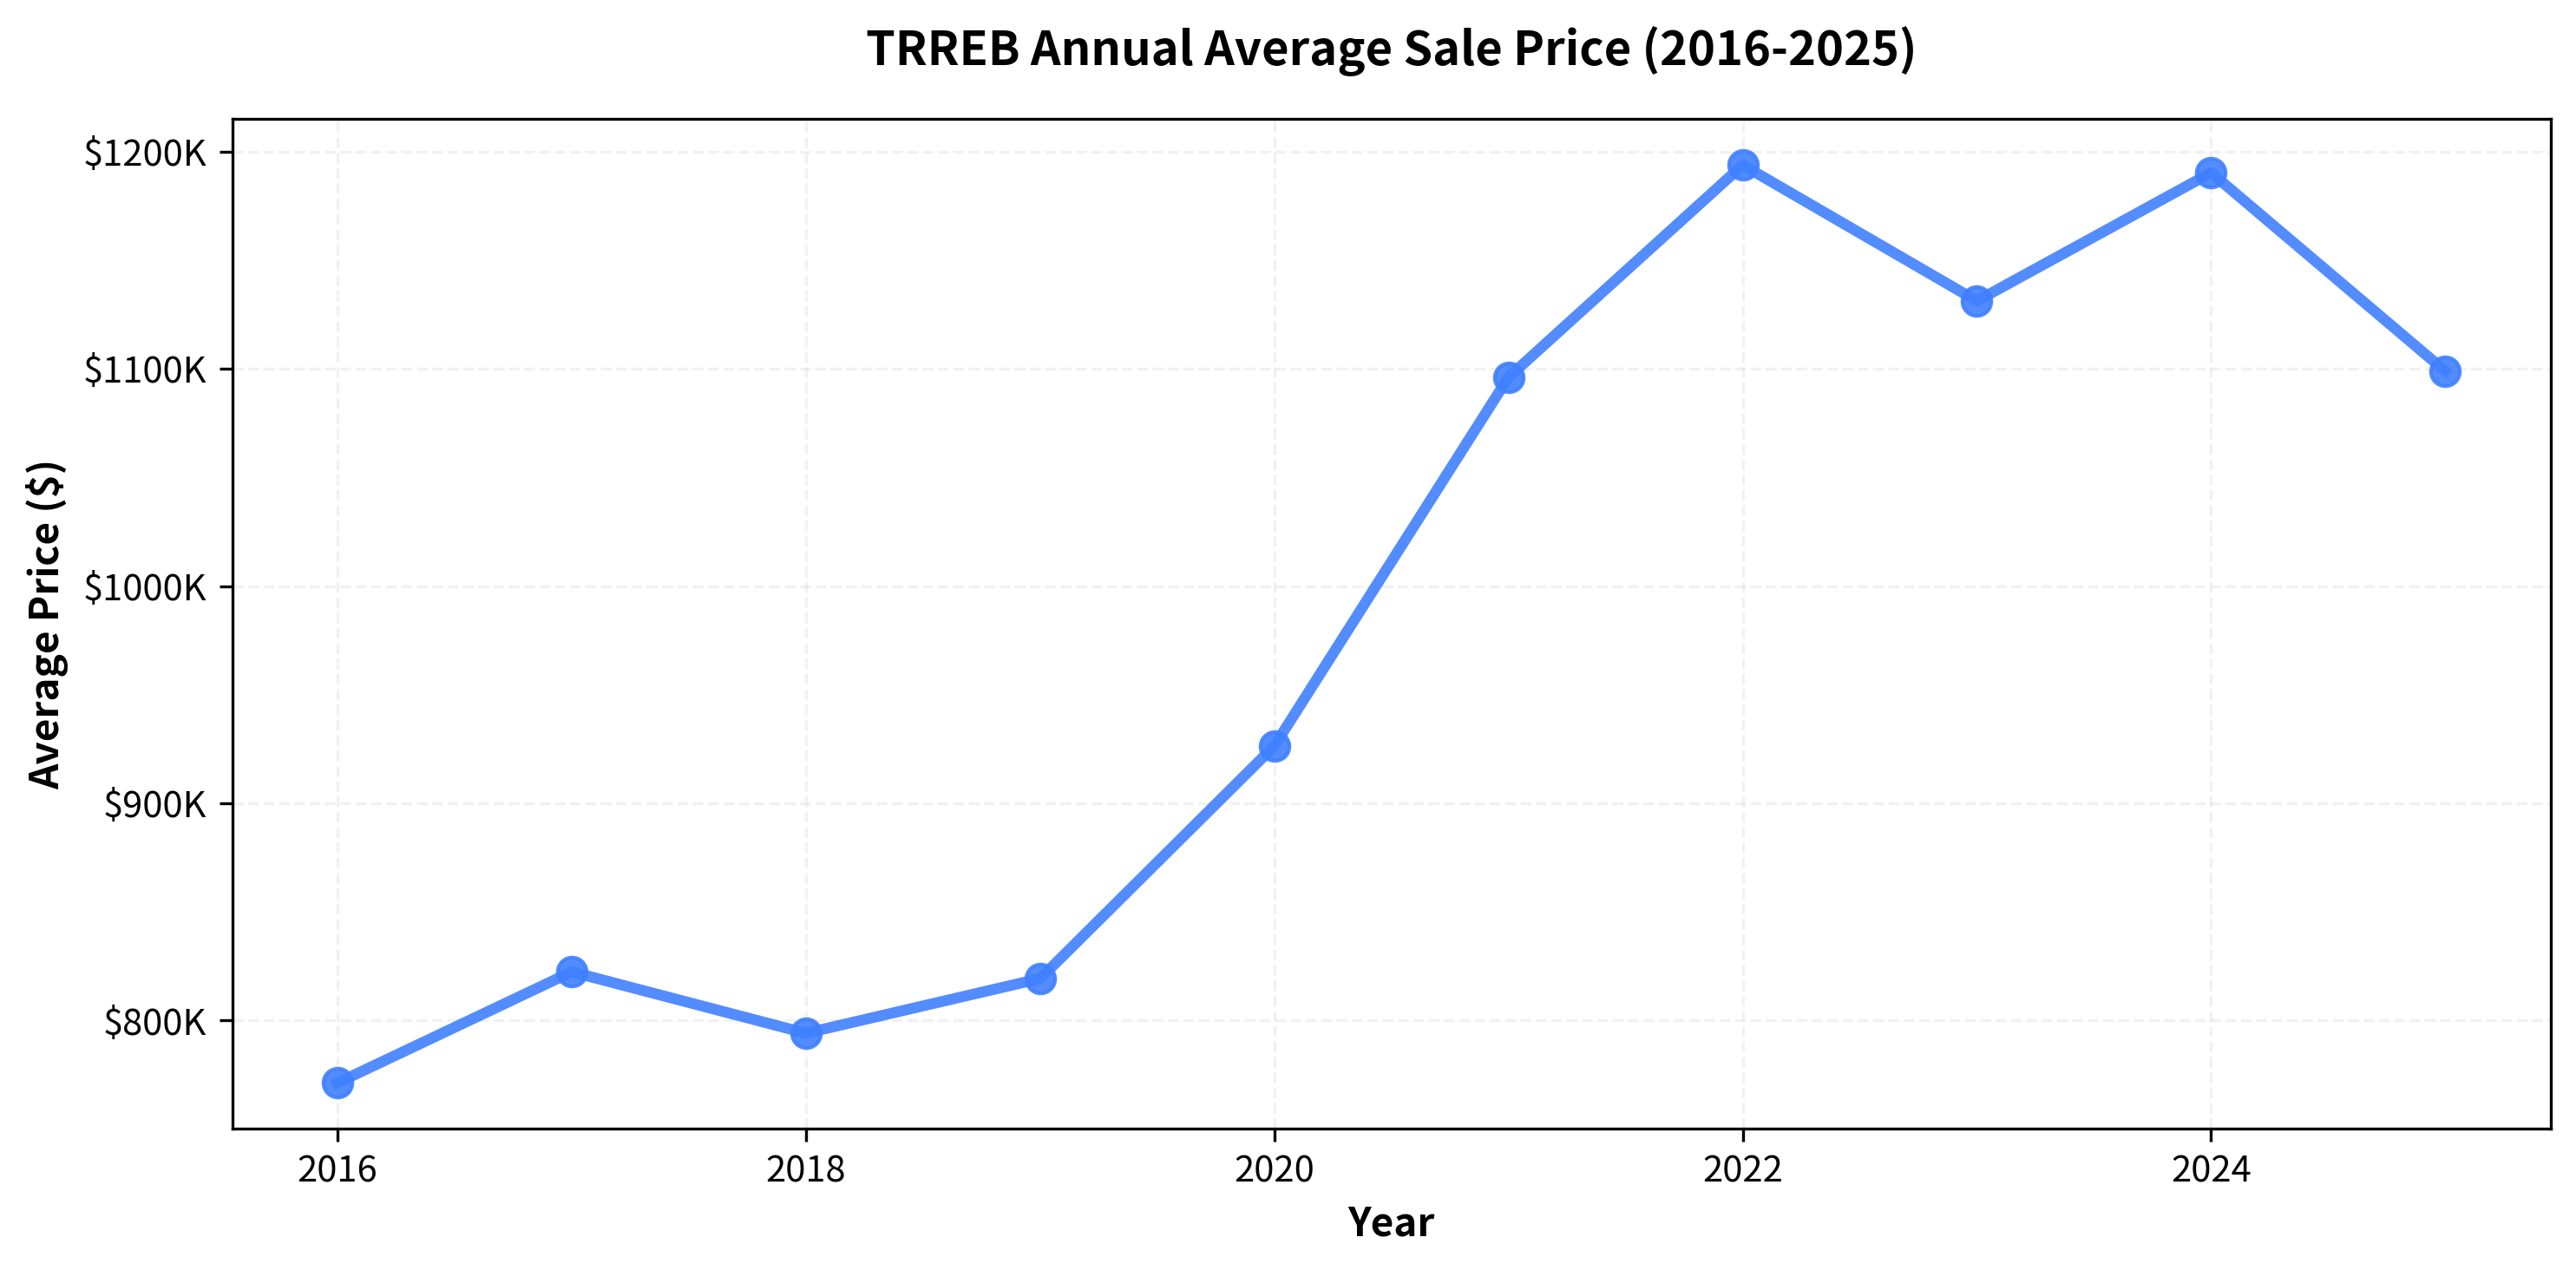
Average prices have followed a similar, albeit more dramatic, trajectory. After a steep
increase culminating in 2022, prices have moderated.
However, the average price in 2025 remains significantly higher than a decade ago, underscoring the long-term appreciation of property values in the GTA. [1]
York Region Spotlight: January 2026 Market Profile
In January 2026, York Region continued to be a significant driver of the GTA real estate
market. This section provides a detailed profile of four key municipalities: Stouffville,
Newmarket, East Gwillimbury, and Markham, based on the latest data from TRREB. [2]
Market Activity & Pricing
The table below summarizes the key market indicators for these municipalities in
January 2026.
Municipality | Average Price | Sales Volume | Active Listings | Months of Inventory |
Stouffville | $1,293,352 | 21 | 169 | 5.3 |
Newmarket | $912,737 | 48 | 228 | 4.4 |
East Gwillimbury | $971,726 | 19 | 130 | 5.5 |
Markham | $1,100,945 | 163 | 769 | 4.7 |
Source: Toronto Regional Real Estate Board, January 2026 Market Watch [2]
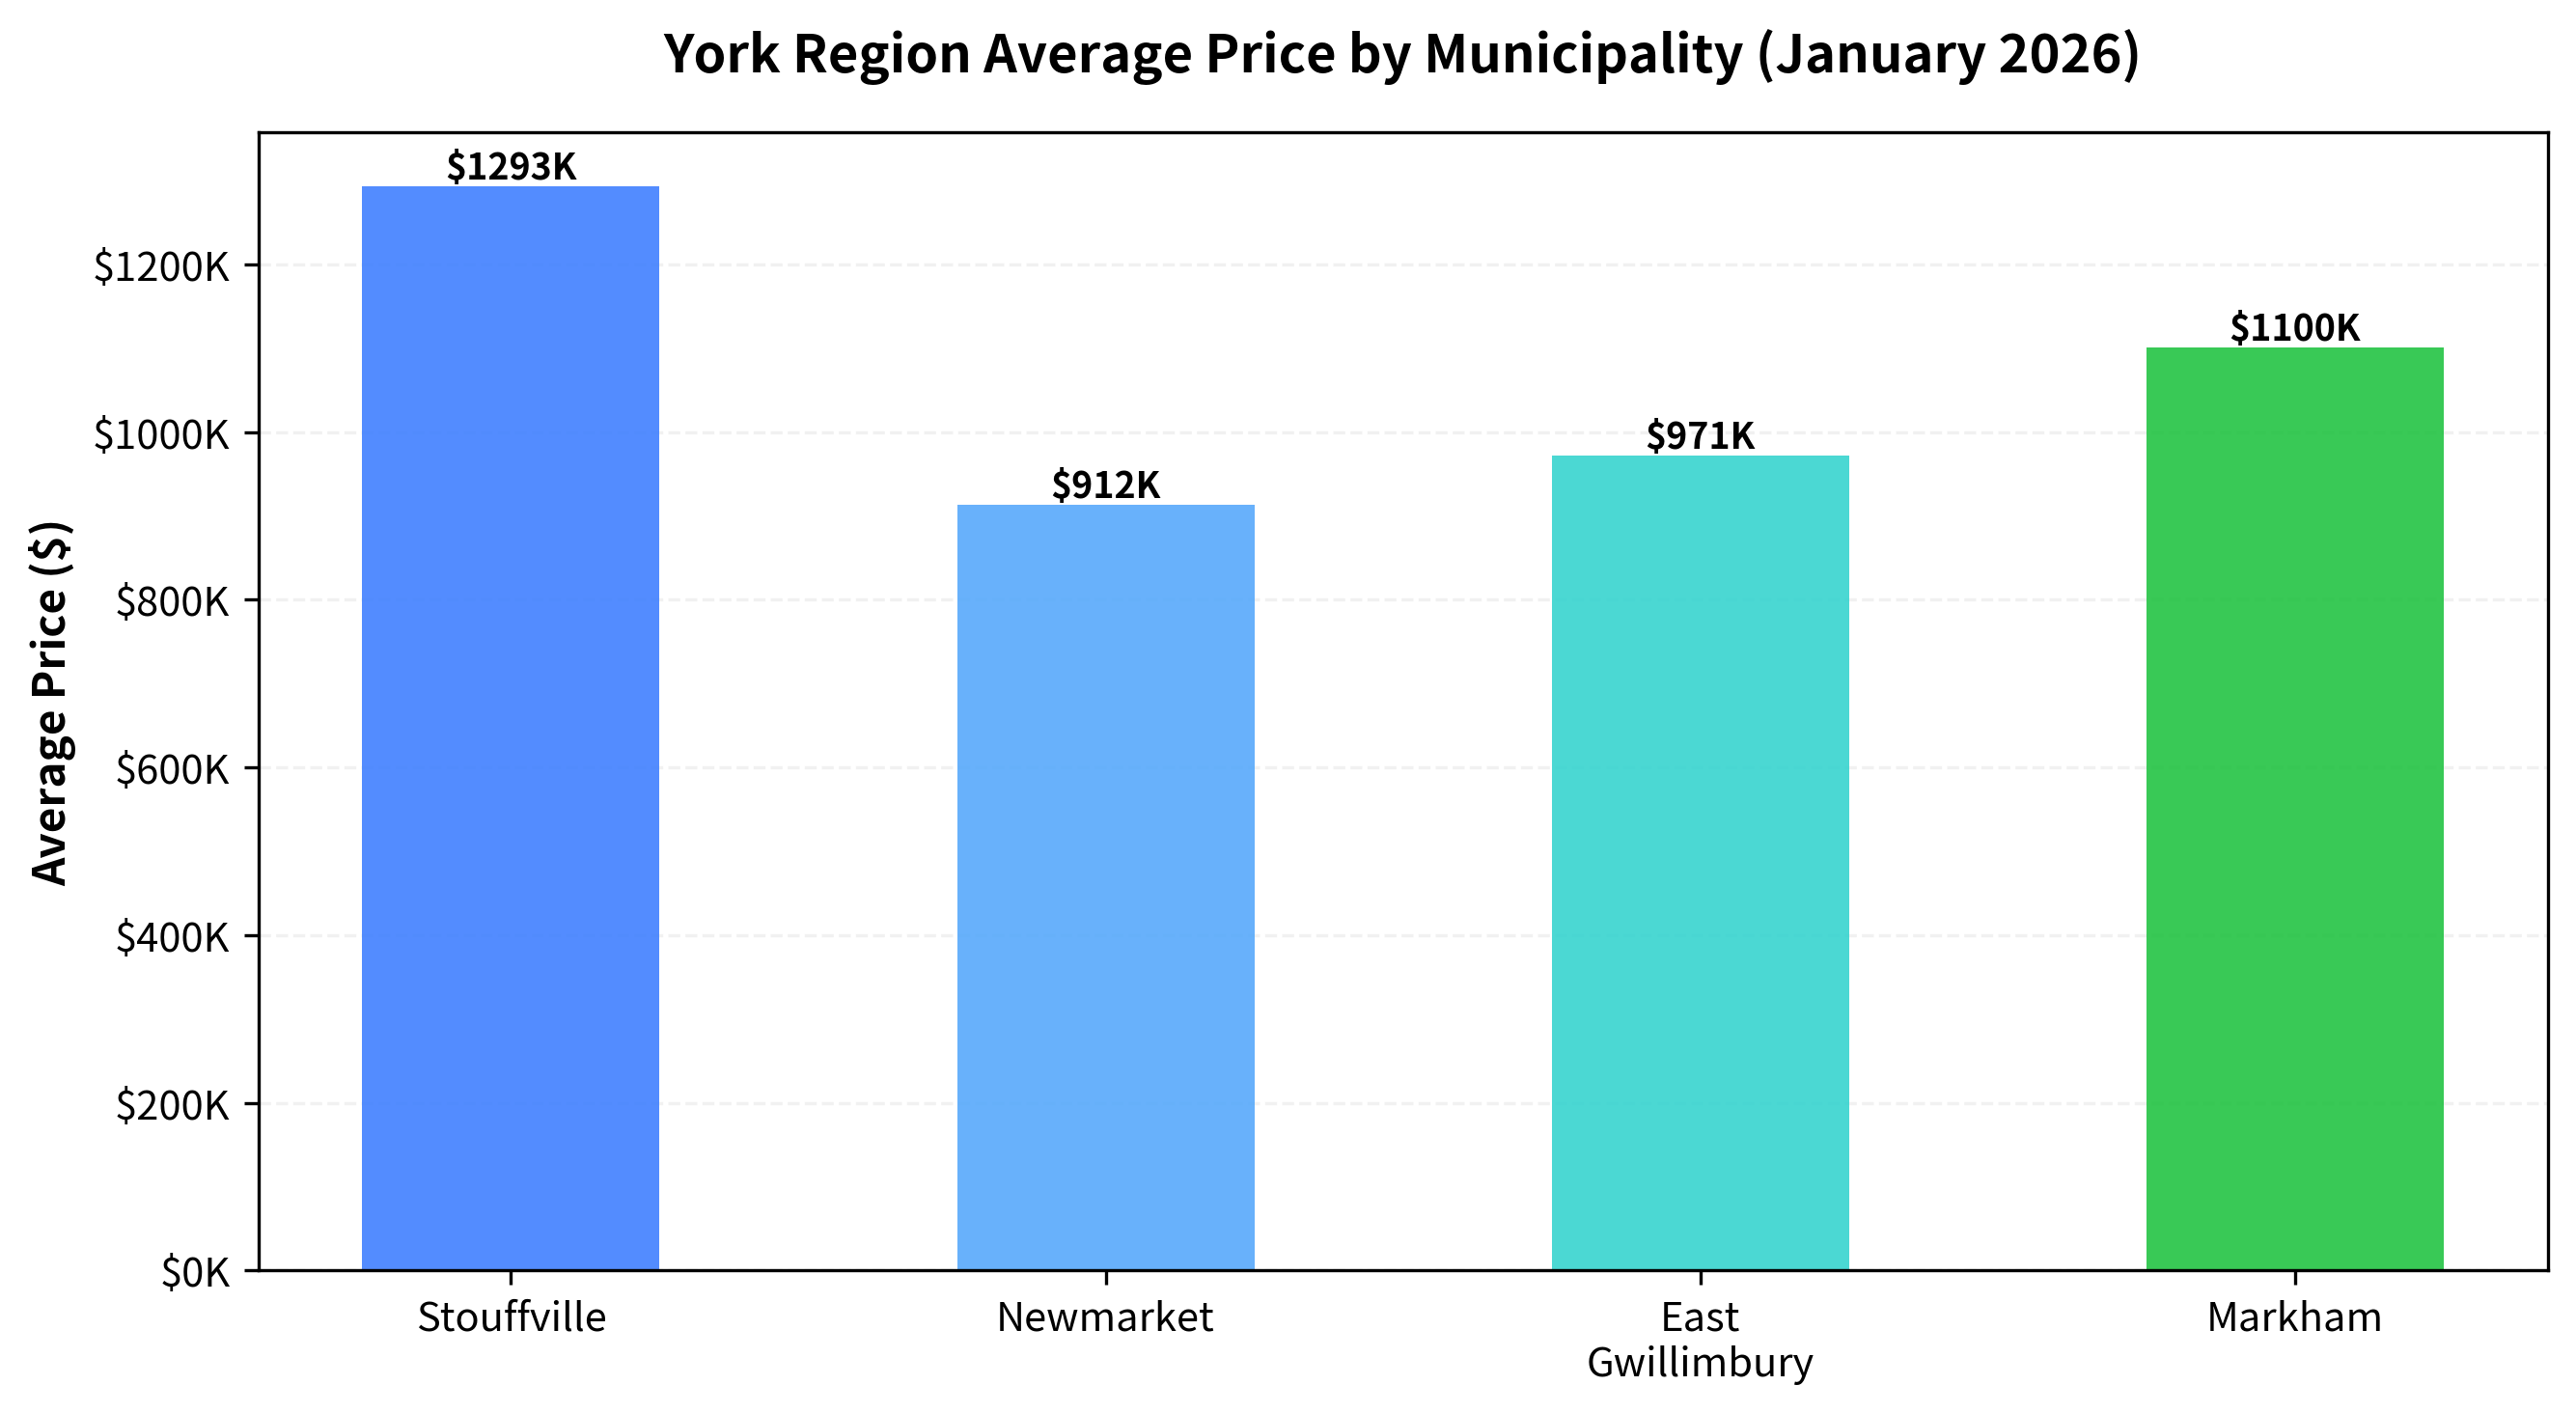
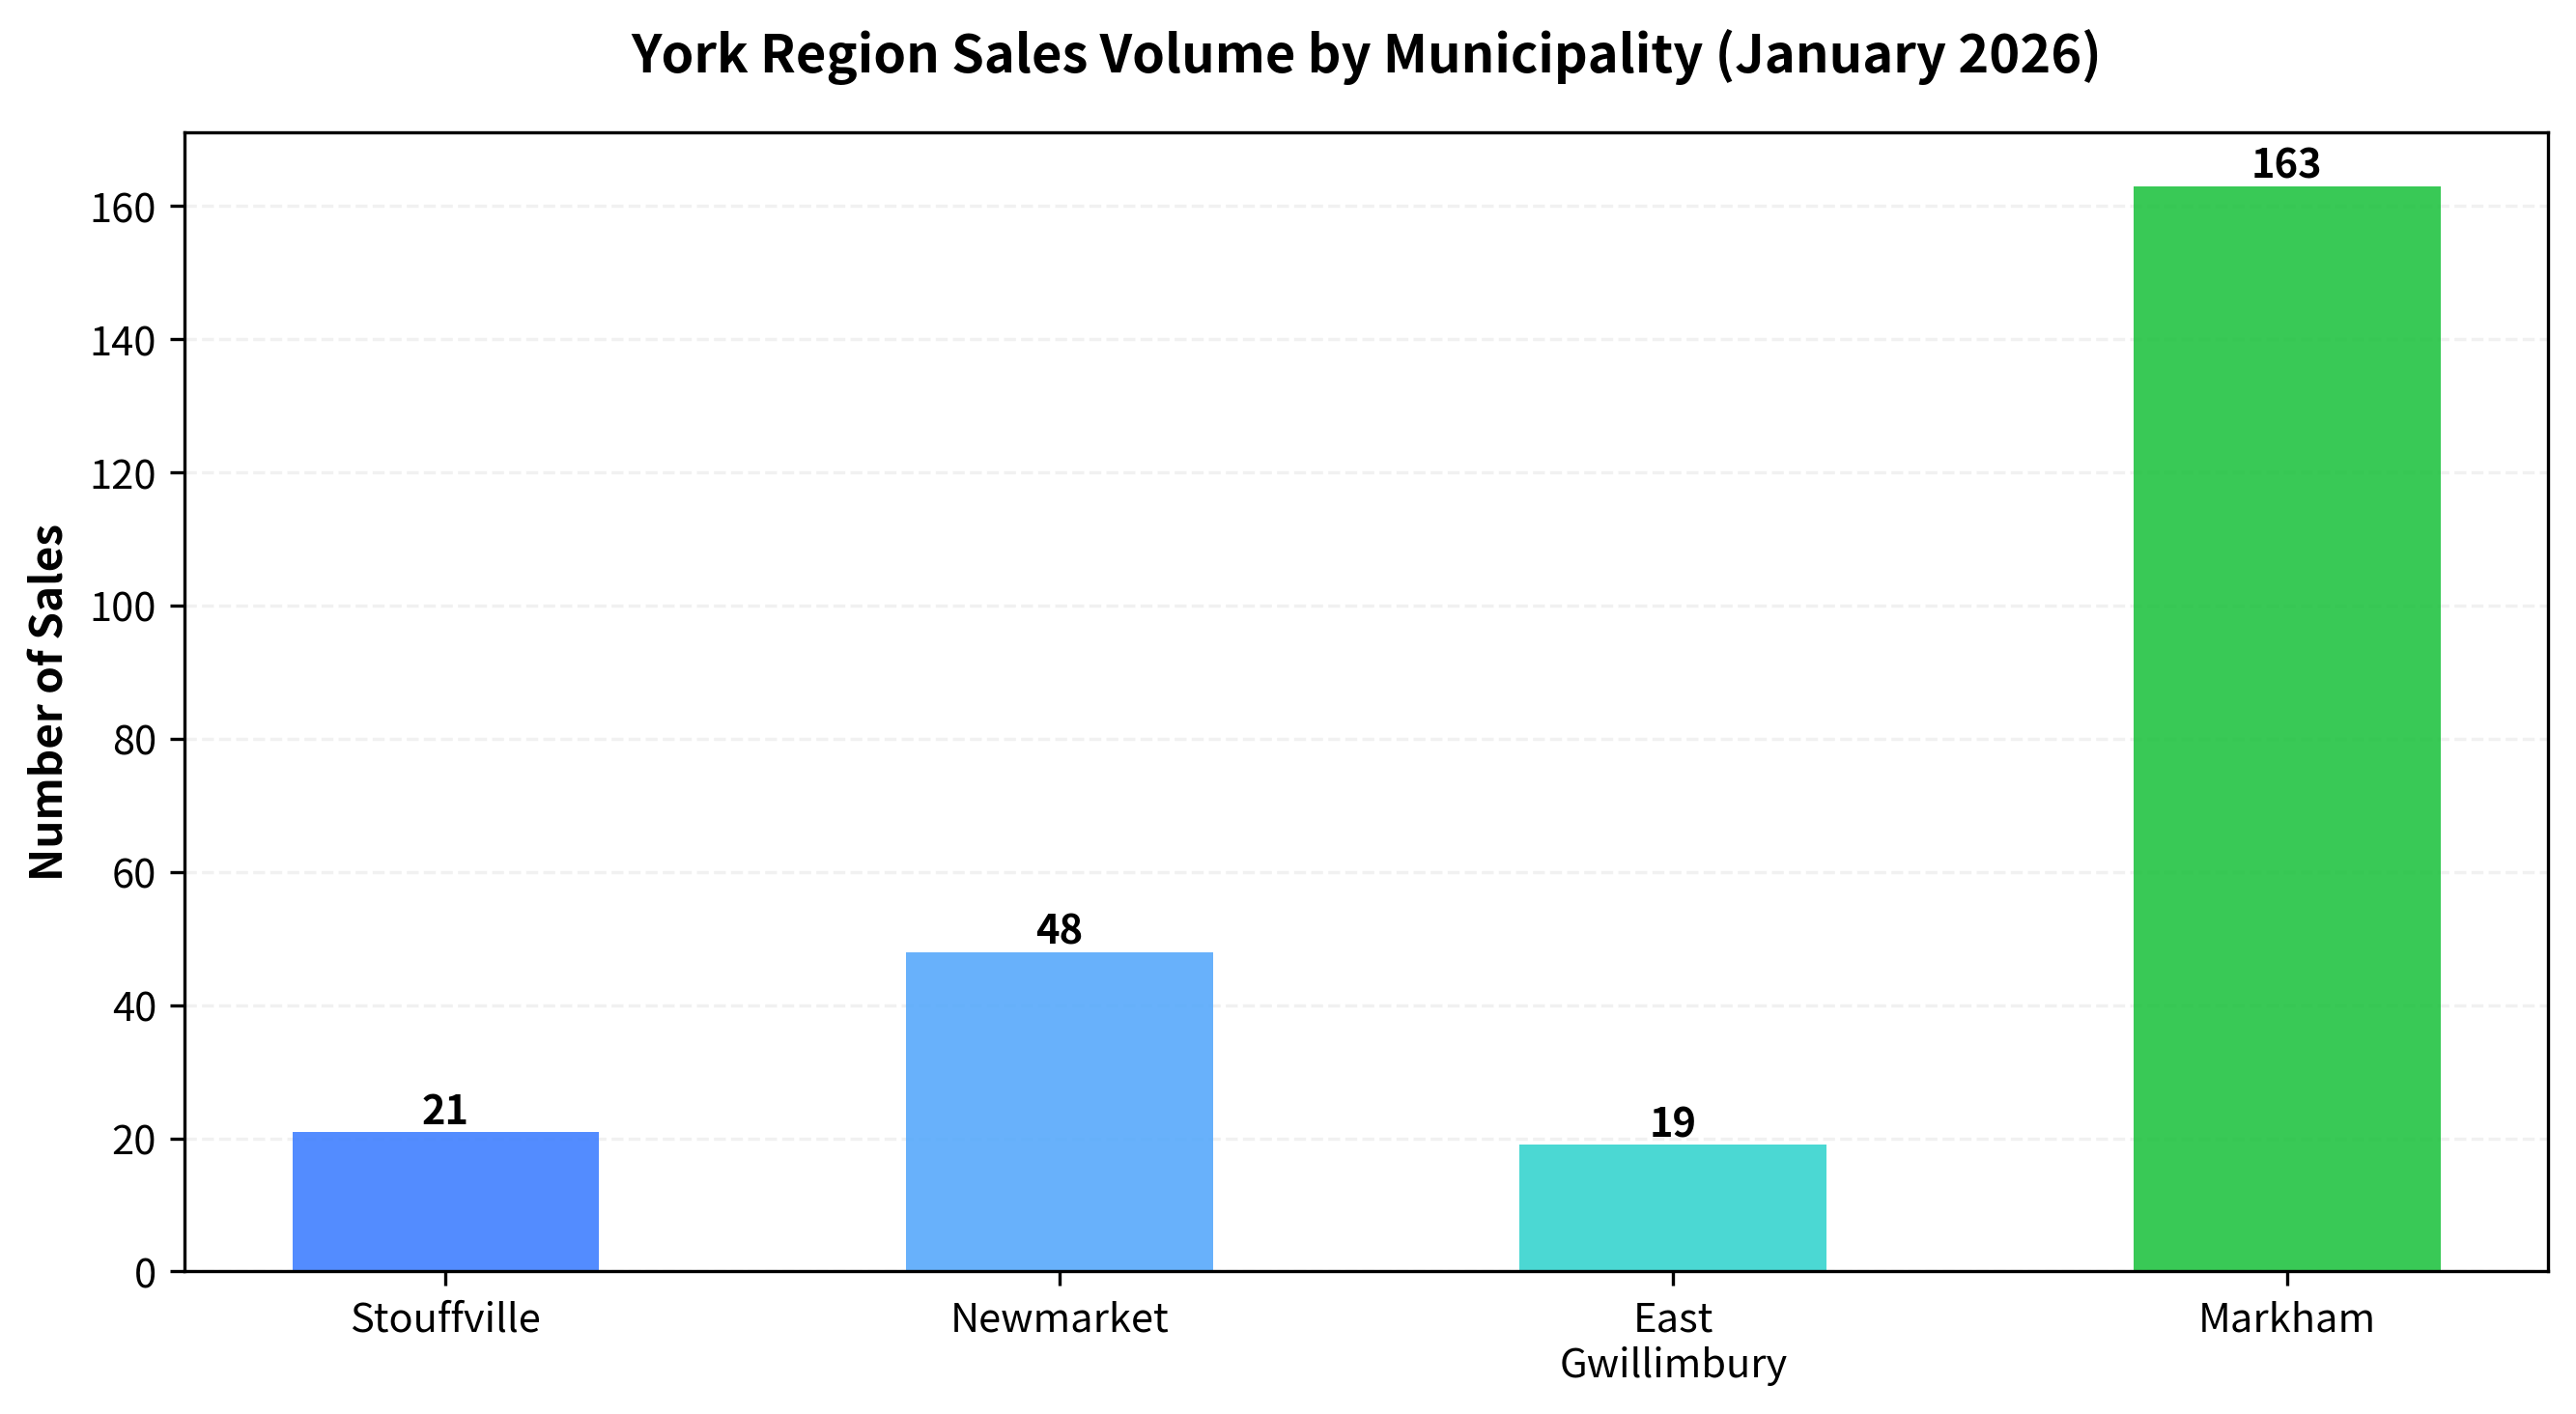
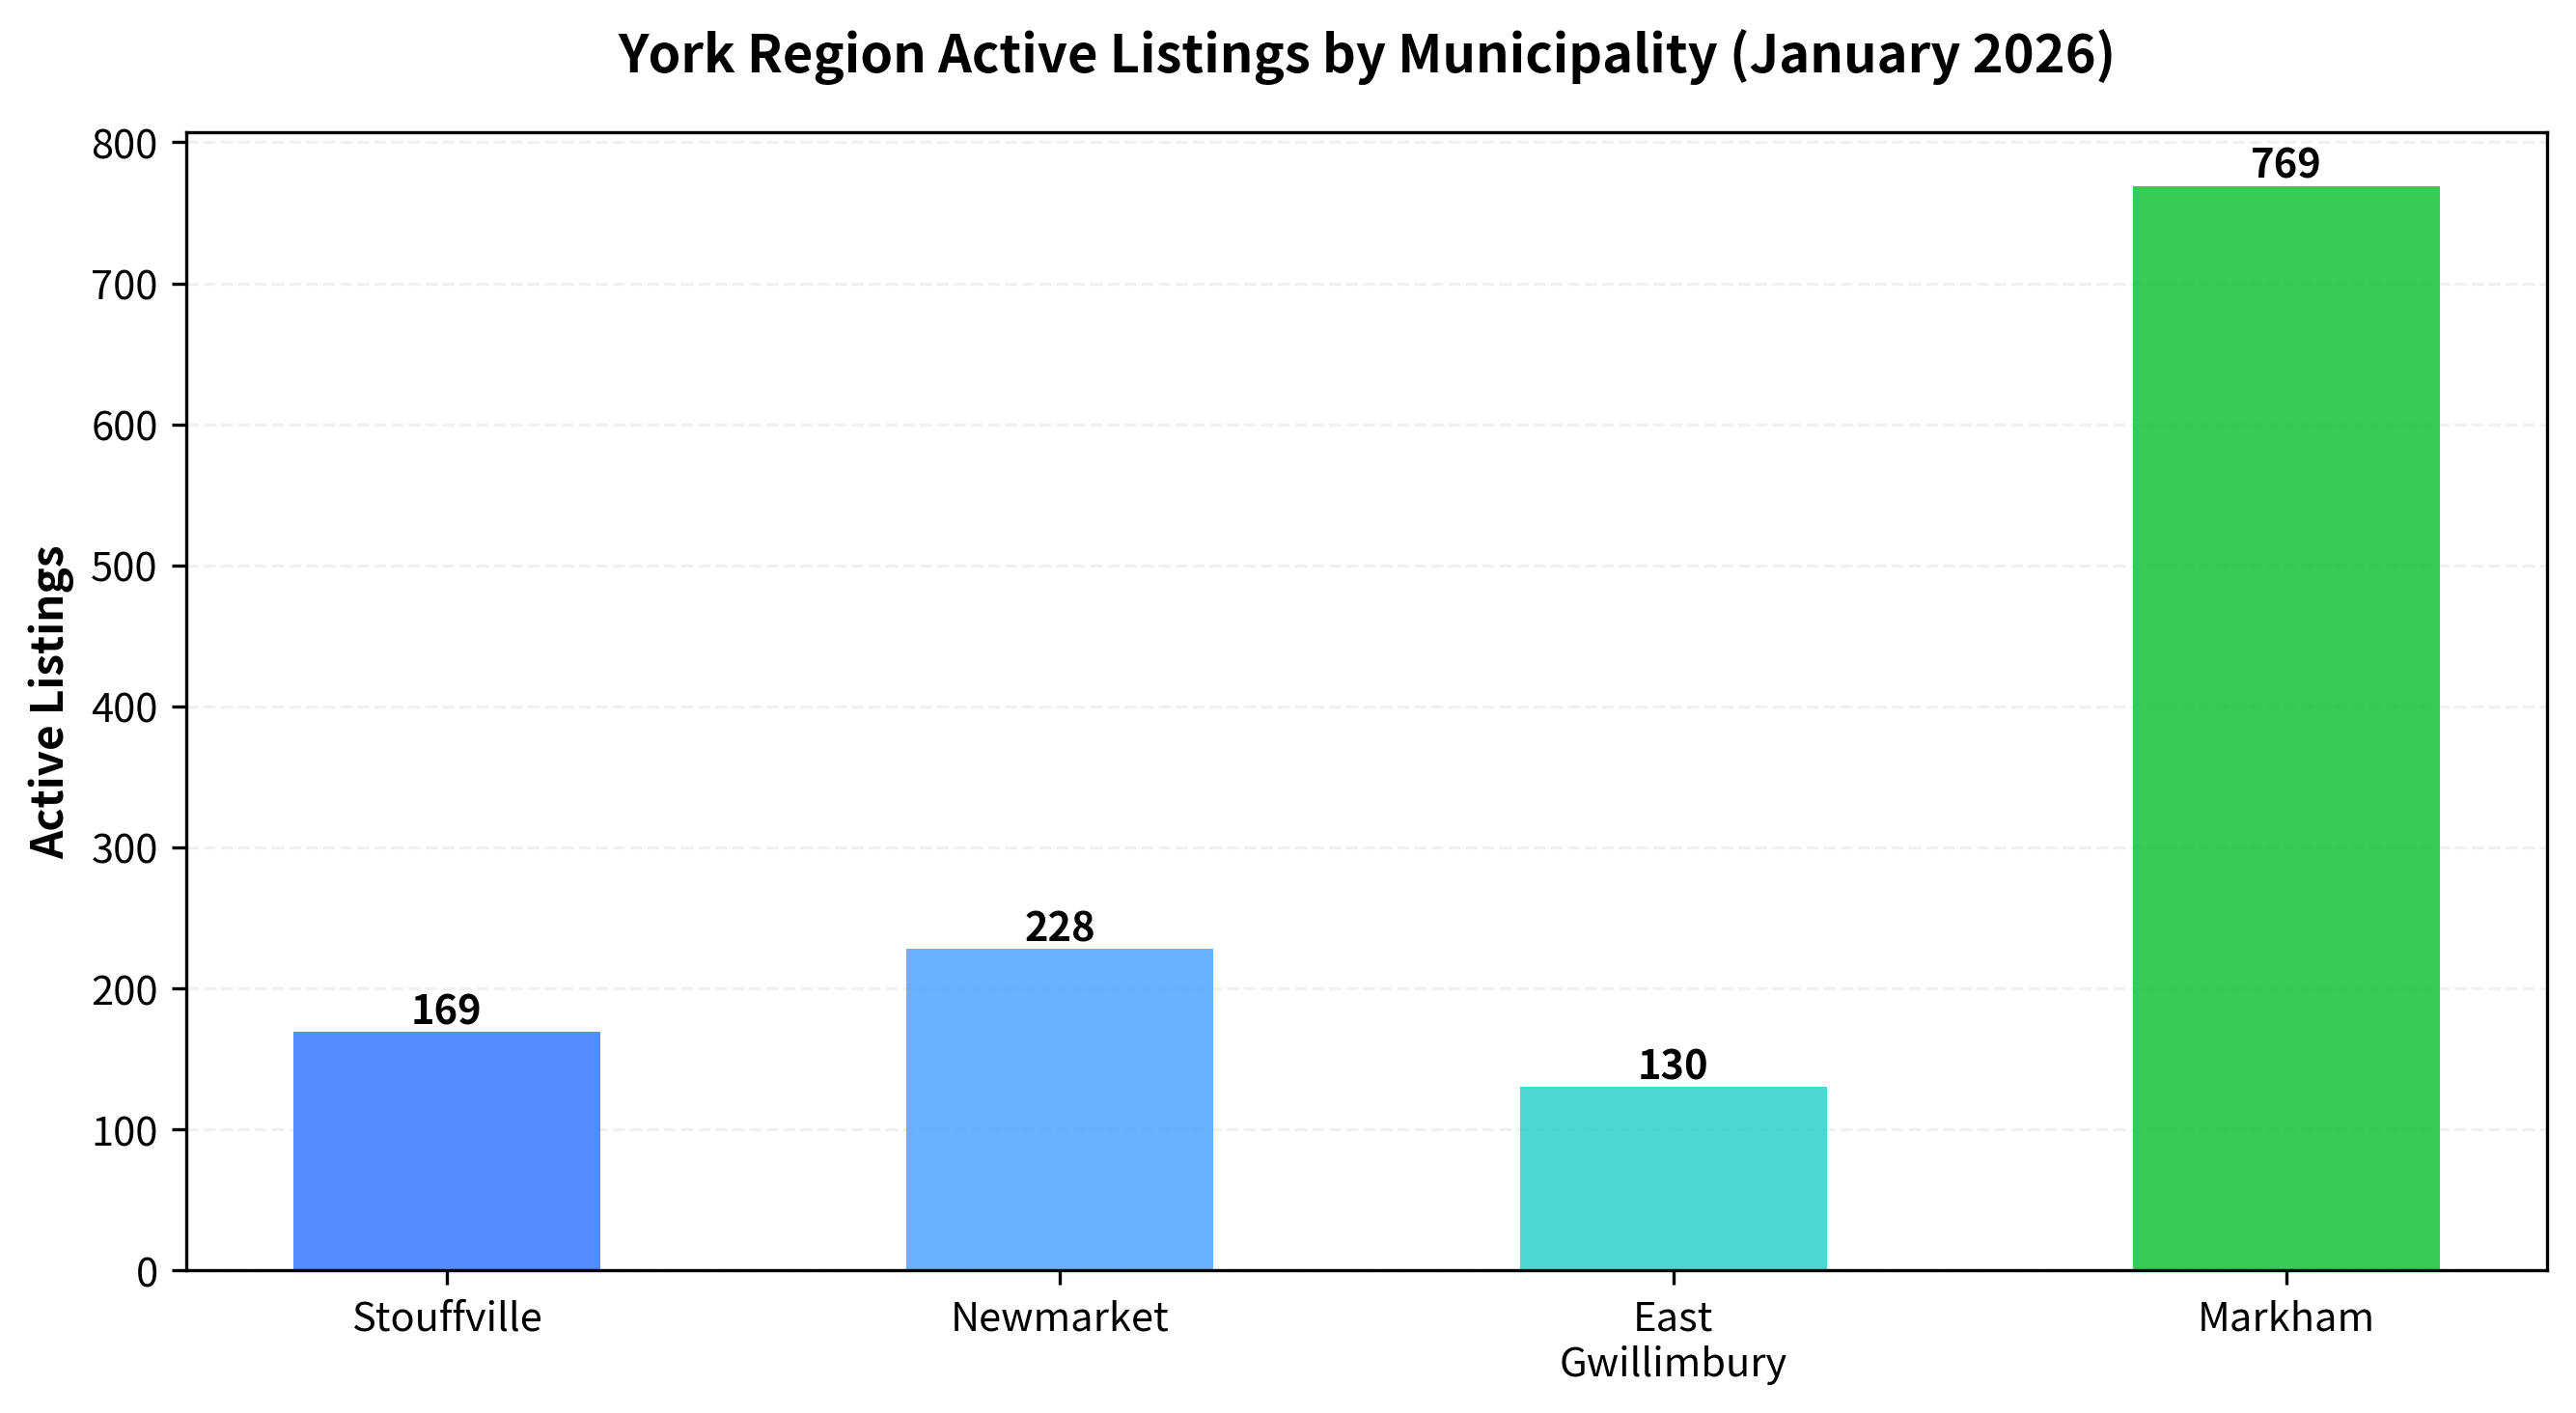
Stouffville recorded the highest average price in January, while Markham saw the
highest sales volume and inventory levels, indicating a more active market.
Inventory and Market Balance
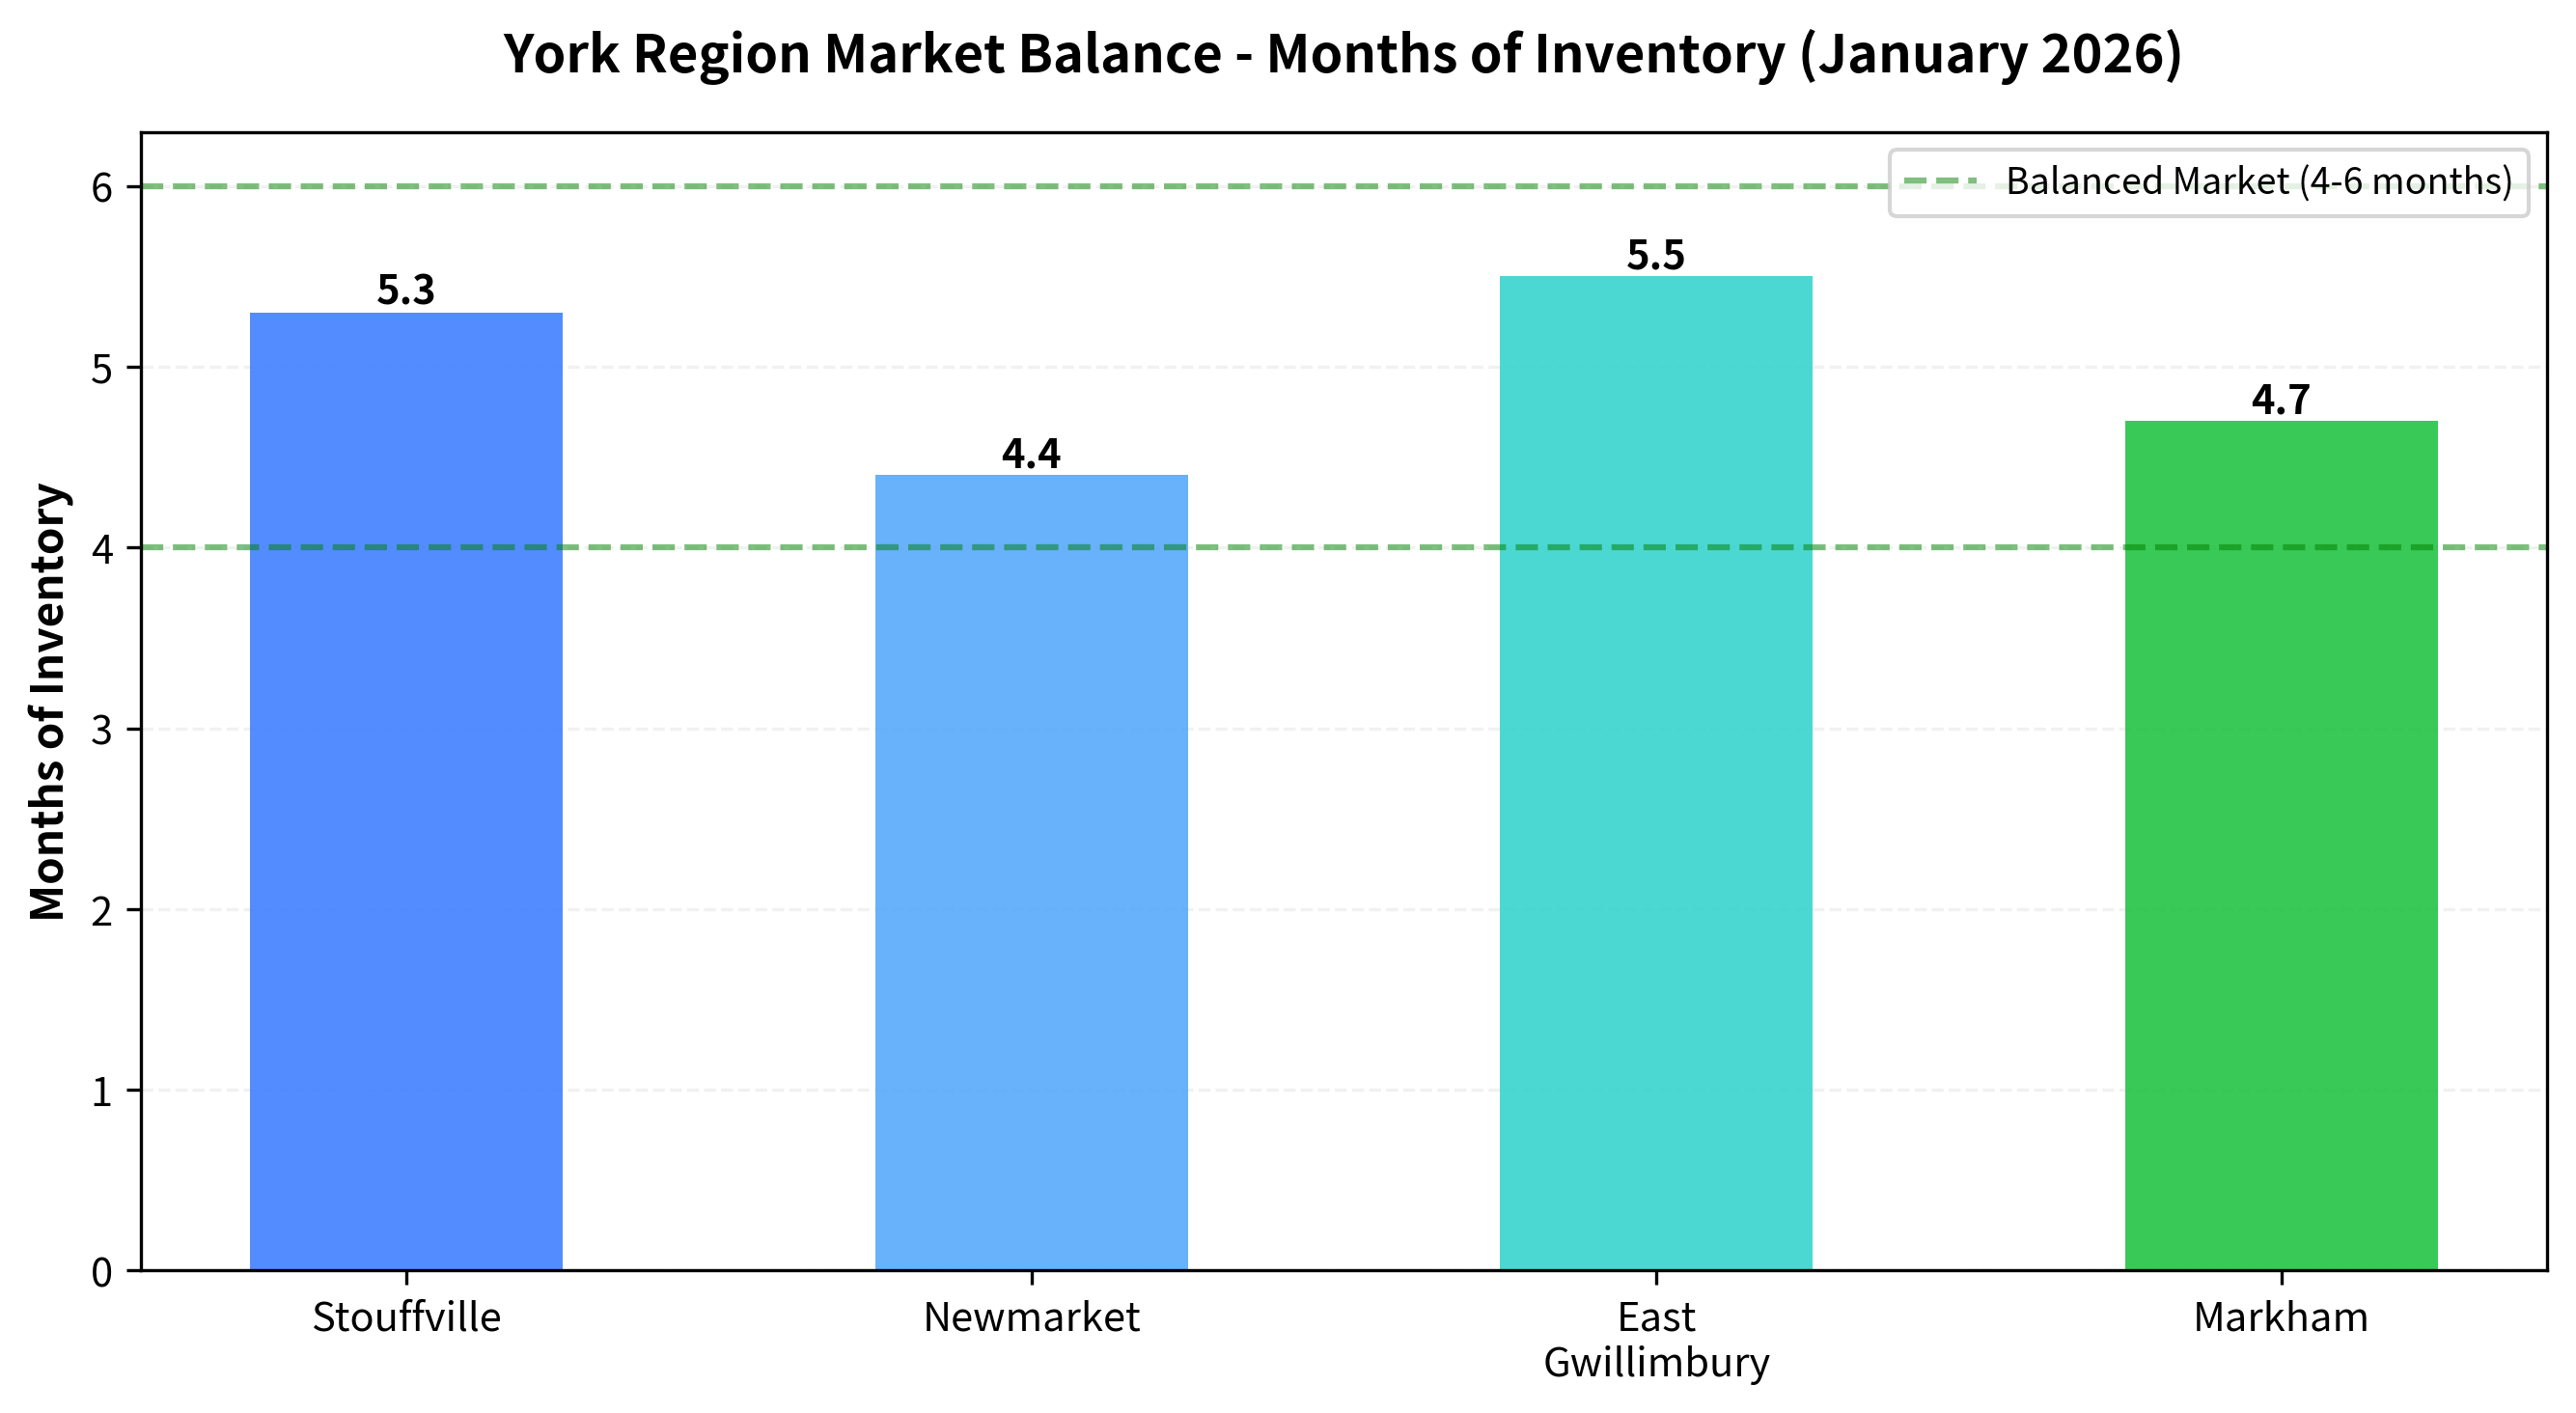
Months of Inventory (MoI) is a key metric for understanding market balance. A
balanced market typically has between 4 and 6 months of inventory. In January 2026,
all four municipalities fell within or very close to this range, suggesting a relatively
stable market environment.
References
[1] Toronto Regional Real Estate Board. (2026). Historic Statistics. Retrieved from
https://trreb.ca/wp-content/files/market-stats/market-watch/historic.pdf
[2] Toronto Regional Real Estate Board. (2026). Market Watch, January 2026. Provided
as an attachment.